


Last month, we launched a way for Forecast’s heat map to show how much of your team’s weekly capacity had been scheduled. While we heard excitement for this new feature, it also replaced a really useful feature that many customers missed: the daily heat map. So shortly after launch, we rolled it back.
Today, we’re excited to reintroduce the weekly heat map, this time alongside the trusty daily heat map. Customers will see a new option on the Team Schedule to select how they would like to view the heat map.
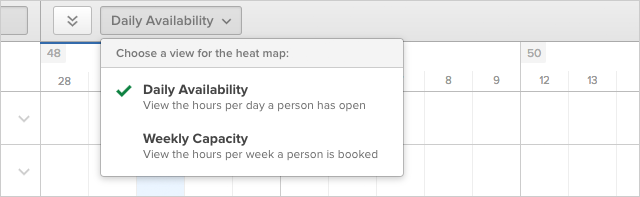
- Daily Availability
This view shows how many hours per day a person is available or overbooked. This is best used to locate available hours in a week to schedule more specific tasks on a daily basis.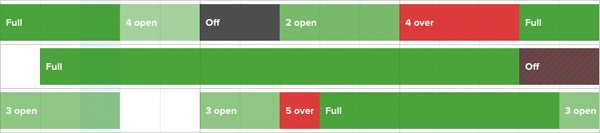
- Weekly Capacity
This view shows how many hours per week a person is booked. It also shows the percent of these scheduled hours against their total capacity. This is best used if you plan in weekly assignments, or if you’re trying to answer high-level questions about your team’s overall availability and health.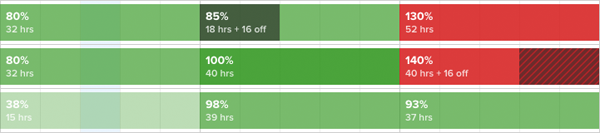
With this improvement, it’s even easier to visually see when your team has availability, who’s over capacity, and when you can start on that exciting new project. We believe these questions are best answered at a high level, and we’re building the solution right into Forecast’s schedule with the new Weekly Capacity heat map.
If you prefer one view over the other, no worries! Forecast will save your preference. If you have any questions, please don’t hesitate to reach out to the team. Happy scheduling!


