


The Projects section hasn’t done a great job at showing how quickly fee-based projects are being completed — until now. We’ve just released an update to Harvest that brings all the features of the time-based Project Graph over to fee-based projects:
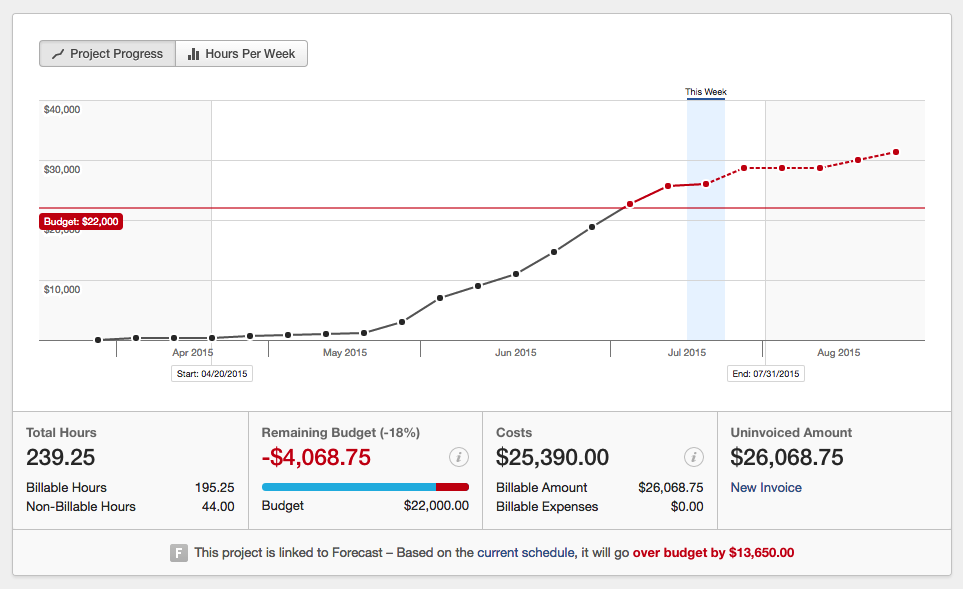
- Budget Spent vs. Budget: Fee-based budget lines are now graphed, and Budget Spent (in your project’s currency) is graphed below it. You can quickly see how much of your budget you’ve used, and if you’ll exceed it.
- Forecasted Budget Spent: If your project is linked to Forecast, we’ll use your billing rate to convert future scheduled hours in Forecast to a projection of budget spent. It’s even easier to see if you’ll exceed your budget with Forecast.
You don’t need to do anything to see this change in your account — just pop over to the Projects section and take a look at a fee-based project (budgeted by Total Project Fees or Fees Per Task) to see the changes. Take it for a spin!
We hope this makes keeping your fee-based projects on budget just a little bit easier – and as always, don’t hesitate to let us know what you think in the comments below or by sending us an email at support@harvestapp.com.


